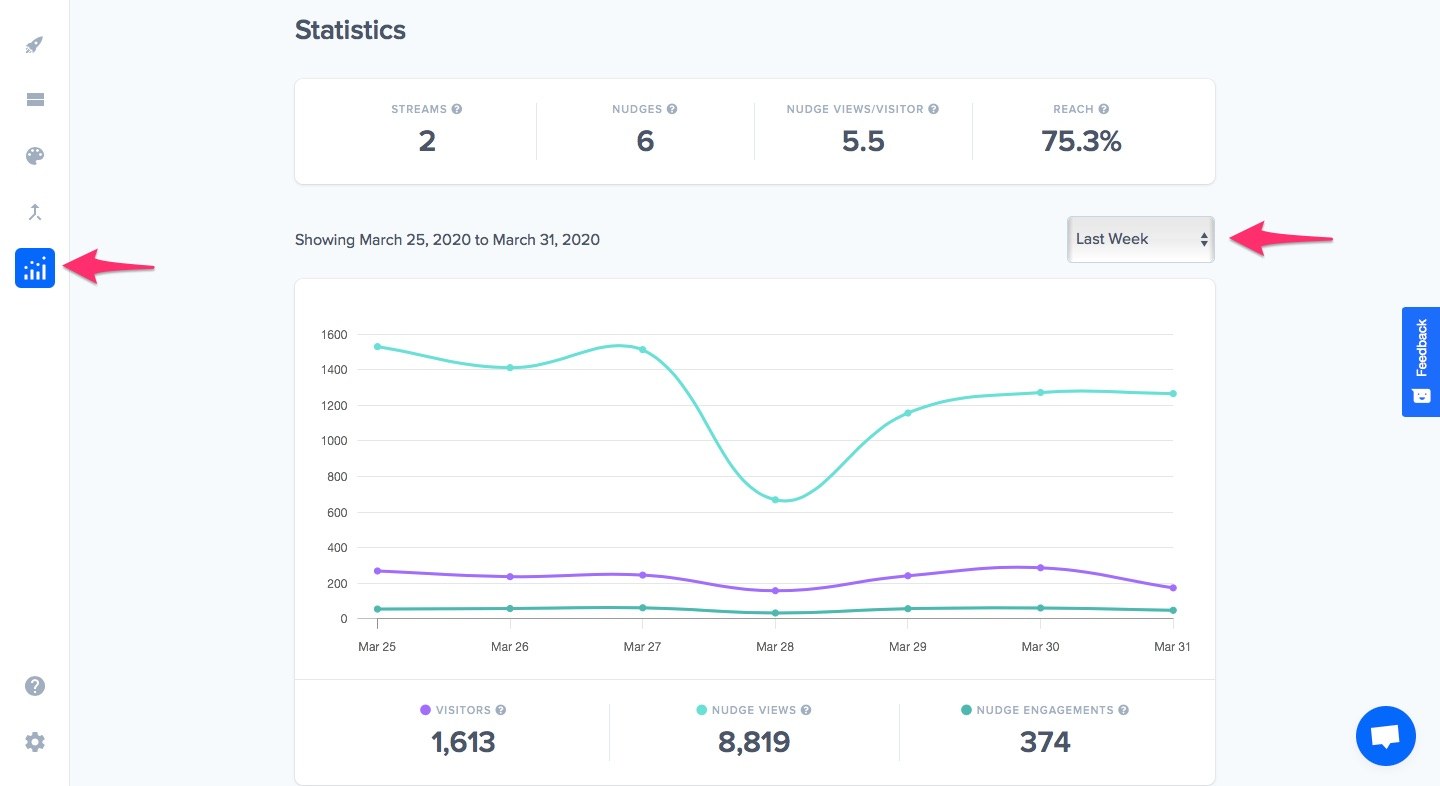
Nudgify has built in statistics on how your Nudges are performing. By viewing your Nudge Statistics via the left side menu, you can see at a glance how many visitors have seen your Nudges, how many Nudges they viewed and the number of Nudge engagements that occurred.

By default, the dashboard shows data for the last 7 days. If you want to see data for a different date range, then select one from the date picker. You can see data for up to 30 days back. Analysing how your Nudges are performing can give you lots of insight on how to optimise or adapt them in the best way possible.
Nudge Statistics Definitions
The following list includes definitions for the metrics that appear on the Statistics page:
- Streams: number of active Nudge Streams on your site
- Nudges: number of active Nudges on your site
- Nudge views/visitor: the average number of Nudges that each of your site’s visitors has seen
- Reach: percentage of your total site visitors that have seen at least one Nudge
- Visitors: number of visitors to pages with the Nudgify Pixel installed
- Nudge views: number of times individual Nudges have been shown, the total number of Nudge impressions
- Nudge Engagements: number of interactions with Nudges, such as hoovers and clicks
