All posts

The median Shopify store converts 1.3% of its sessions into orders. That's from Littledata's benchmark of 450 Shopify stores, covering August to November 2026. The top 20% of stores convert above 2.8%.
The mean is higher, 1.9%, because a small group of stores convert far above everyone else. That's why "average" numbers you see quoted elsewhere often look better than what a typical store gets.
This page does three things. It shows you how to compare your store fairly, how to find which part of your funnel is leaking, and what to fix for each leak.
Boost Your Conversion Instantly with Nudgify: Turn your website visitors into customers with real-time Social Proof and FOMO Nudges. Get Started Now →
What is a good Shopify conversion rate?
A good conversion rate is one that beats other stores selling similar things to similar people. The overall median is a starting point, not a target.
Here's how 450 Shopify stores spread out, per Littledata (90 days to 7 November 2026, sessions with a purchase divided by all sessions):
| Where your store sits | Conversion rate |
|---|---|
| Bottom 20% | below 0.5% |
| Median | 1.3% |
| Top 20% | above 2.8% |
| Top 10% | above 3.6% |
Industry changes the picture more than anything else. These are Littledata's medians for the industries with at least 30 stores in the sample, same period:
| Industry | Median | Top 20% |
|---|---|---|
| Beauty & Skincare | 2.8% | 3.9% |
| Health & Supplements | 2.6% | 3.7% |
| Food & Beverage | 2.1% | 3.7% |
| Fashion & Apparel | 1.1% | 1.7% |
| Home & Furniture | 1.1% | 1.8% |
So 1.5% is weak for a skincare brand and well above the median for a furniture store. Consumables people reorder convert better than clothes people have to try on or sofas they buy once.
Increase Trust & Sales with Social Proof
Boost trust, engagement, and conversions with Social Proof — tailored for any industry and easy to integrate. Seamlessly manage client access with our team portal.


Device matters less than you might expect. In the same data the median is 1.5% on mobile and 1.2% on desktop. Mobile is also where the traffic is: the median store gets 66% of its sessions from phones.
If you want more cuts of the data, we keep full benchmark tables by industry and device on a separate page. And if you just want a quick yes or no on your own number, there's a short self-check: is my Shopify conversion rate good?
How to calculate your Shopify conversion rate
The formula is simple:
Conversion rate = sessions that completed checkout ÷ total sessions × 100
Say your store had 12,000 sessions last month and 156 of them ended in a purchase. 156 ÷ 12,000 × 100 = 1.3%. That's exactly the median.
If you want the detail on what Shopify counts as a session and an order, we cover how Shopify calculates conversion rate on its own page.
Shopify shows you this in two places:
- Analytics > Reports. The Conversion rate over time and Conversion rate breakdown reports give you the rate and the funnel behind it. Here's how to find your conversion rate in Shopify Analytics, step by step.
- Live View. It doesn't show a rate, but its customer behavior panel counts active carts, checking out and purchased over the last 10 minutes. Handy during a sale or a launch.
Now the trap. Shopify's conversion rate is per session, not per visitor. One person who visits three times and buys once counts as one conversion out of three sessions. Google Analytics 4 has both a session key event rate and a user key event rate. If you compare Shopify's number with GA4's user-based number, they won't match, and neither is wrong. Pick one and stick with it.
Diagnose before you optimize
Most CRO advice is a list of tactics. The problem is that a store with a checkout problem doesn't need better product photos, and a store whose visitors never add to cart doesn't need a faster checkout.
Shopify's Conversion rate breakdown report splits your sessions into a funnel:
- Sessions with cart additions
- Sessions that reached checkout
- Sessions that completed checkout
Work out two rates from it and compare them with Littledata's November 2026 Shopify medians:
- Add-to-cart rate (sessions with a cart addition ÷ all sessions). Median 6.9%, top 20% at 13% or more.
- Checkout completion rate (sessions with a purchase ÷ sessions that started checkout). Median 47%, top 20% above 64%.
Then use this table to decide where to start:
| What's low | What it usually means | Start with fixes |
|---|---|---|
| Add-to-cart rate | Visitors don't trust the store, don't get the product, or can't see the price, shipping and returns | 3, 4, 5, 6, 9, 10 |
| Cart to checkout | Surprise costs, or the cart page gives people a reason to leave | 3, 8 |
| Checkout completion | Extra costs, forced accounts, missing payment methods, a long checkout | 2, 7, 8 |
| All of them, mostly on mobile | The store is slow, or the right products are hard to find | 1, 11 |
Two cautions. First, low traffic makes these numbers jumpy. Use at least 30 days. Second, check that your traffic is real. A spike of bot sessions will drag every rate down and send you fixing the wrong thing.
12 ways to increase your Shopify conversion rate
These are roughly in order of how often they're the real problem. Where we have a sourced number for impact, it's here. Where we don't, we say so.
1. Fix mobile load time
Two-thirds of a typical store's sessions are on a phone, so a slow mobile page hits most of your visitors.
On Shopify the usual causes are app scripts (every app you install can add code to every page, and uninstalled apps sometimes leave code behind), oversized hero images and sliders, and stacks of tracking pixels.
Shopify has a free web performance dashboard. There's a summary on the Online Store > Themes page and full reports under Analytics > Reports. It uses real visitor data from the last 30 days and marks app installs and theme changes on the chart, so you can see which change slowed you down.
Remove apps you don't use, compress your largest images and drop any pixel nobody reads. Impact varies a lot by how slow you started.
2. Make checkout faster
Shopify's checkout is hard to break, but easy to leave half set up.
Turn on Shop Pay, Apple Pay and Google Pay in your payment settings. Shopify claims Shop Pay converts "as much as 50% better" than guest checkout. That figure comes from Shopify's own study with a consulting firm (April 2023), so treat it as a ceiling, not a forecast.
Don't force account creation. In Baymard Institute's survey, 18% of US shoppers who abandoned a checkout did it because the site wanted an account, and 17% because checkout was too long or complicated.
Then cut checkout extras you don't need: optional fields, a separate company-name line, a phone number you never call.
3. Add trust signals where people hesitate
19% of abandoning shoppers in Baymard's survey said they didn't trust the site with their card details. That's a fixable problem.
Put reassurance where the doubt happens, not in the footer. Next to the add-to-cart button: your returns window in plain words, delivery time, and the payment methods you accept. On the cart page: the same returns line and a way to contact you.
Small or new stores get more from this than established brands, because visitors have no history with you. A real phone number or a named person in your About page does more than a row of generic security badges.
Impact varies. It's cheap to do, so do it early.
4. Show real-time proof that people buy here
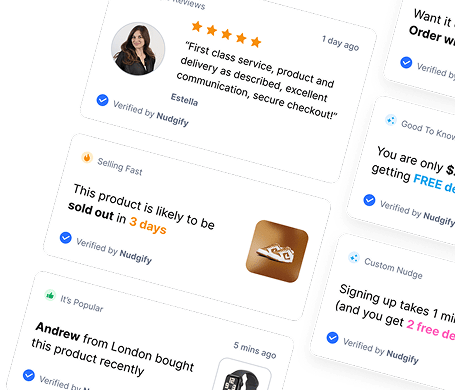
A visitor alone on your site can't see anyone else shopping. Social proof fills that gap: recent orders, how many people are viewing a product, low stock that's actually low.
Two rules. Show real data only. Fake "someone in London just bought this" popups get spotted, and the trust you lose costs more than the sales you gain. And place them carefully: on product and cart pages, not as a stream of popups covering your homepage.
Nudgify is our app, and it shows sales pop notifications for Shopify built from your actual orders, plus visitor counts and stock levels. Other apps do similar things.
Impact varies by how much traffic and how many orders you have. Low-order stores have less proof to show.
5. Rewrite the top of your product pages
On a phone, the first screen of a product page has to answer four questions: what is it, how much, how fast can I get it, and can I send it back.
Many Shopify themes push shipping and returns into a tab or the footer. Move a one-line summary of each up next to the price. If you have a free shipping threshold, say it here.
Replace the opening paragraph of your description with what the product does for the buyer. Keep specs lower down for the people who want them.
Check this on your own phone, not on desktop. Then look at your add-to-cart rate for that product over the next month. This is a change you can measure without an A/B test.
6. Add product video or 3D views
Photos show what a product looks like. Video shows how it moves, fits, pours or folds, which is often the thing people are unsure about.
Shopify's product media takes video and 3D models alongside images, so you don't need an app for the basics, as long as your theme displays them. A 20-second clip shot on a phone, showing the product in use, often does more than a polished brand film.
Prioritize products with a high bounce rate or a high return rate. Those are the ones where people can't tell what they're getting.
We don't have a reliable, sourced figure for the lift from video. Impact depends heavily on the product. It matters more for clothing, gadgets and anything with moving parts than for a bag of coffee.
7. Recover abandoned checkouts
Some people will leave whatever you do. Baymard's average documented cart abandonment rate is 70%. Get some of them back.
Shopify sends abandoned checkout emails for free. Turn them on under Apps > Messaging > Automations, in the "Abandoned checkout emails by Shopify" automation (Shopify help). Two catches: a checkout only counts as abandoned after 10 minutes, and only if the customer entered an email address.
That second catch is why the email field early in checkout matters. For visitors who leave before checkout, an exit-intent offer can catch a few, but keep it to one popup per visit.
Impact varies, but this costs nothing to switch on.
8. Show shipping costs before checkout
This is the biggest single reason people abandon. In Baymard's survey, 40% of US shoppers who abandoned a checkout did it because extra costs (shipping, tax, fees) were too high.
The word that matters is surprise. People accept shipping costs they expected. They leave when the total jumps on the last screen.
Put your shipping rates, or at least a "from" price, on product pages and in the cart. If you offer free shipping over a threshold, show a running "you're $12 away" message in the cart. If your prices include tax, say so.
Also 20% abandoned because delivery was too slow, so show the delivery estimate too.
9. Add a size, fit or compatibility guide
Fashion and home are the two lowest-converting categories in Littledata's data, both at a 1.1% median. Both have the same problem: people can't try the product before buying.
A size guide with real measurements in centimetres and inches, not just S/M/L, removes the main doubt for clothing and shoes. For furniture, give dimensions and a photo with something for scale. For parts and accessories, a "fits these models" list.
Put the guide next to the size or variant selector, in a popup, so people don't leave the page to find it.
A good guide also cuts returns, which matters as much as the extra sales.
10. Put reviews on the product page
Reviews belong next to the price, not in a tab people never open.
Research from Northwestern's Spiegel Research Center (2017) found a product with five reviews was 270% more likely to be bought than one with none. The effect was bigger for higher-priced products (380%) than lower-priced ones (190%).
The jump from zero to five reviews is the big one. So send a review request email after every delivery, and focus on getting your best sellers past five reviews first.
Show the star rating near the product title, and a few full reviews below the fold. Don't hide or delete the bad ones. A page of nothing but perfect scores is harder to believe than an honest mix.
11. Fix site search and collection filters
If people can't find the product, nothing else on this list matters.
Shopify's free Search & Discovery app covers most stores. It adds filters to collection pages, synonym groups (so "sofa" finds "couch"), product boosts in search results, and related product recommendations.
Start by looking at what people search for on your store and which searches return nothing. Fix those with synonyms or better product titles. Then add filters for the things people actually choose by: size, colour, price, material.
Impact varies, and it's bigger for stores with large catalogues. A store with eight products can skip this one.
12. Test one change at a time
Change five things at once and you'll never know which one worked, or which one hurt.
Shopify now has a built-in A/B testing tool called Rollouts, under Markets > Rollouts. Shopify's changelog (March 2026) says it can test theme changes against your current theme with real traffic and is available on Basic and higher plans.
Test the change most likely to matter, based on your diagnosis. Write down what you expect to happen before you start.
Be honest about whether your store has the traffic to test at all. Most don't, which is the next section.
How to run a CRO test that tells you something
A/B testing needs more traffic than most Shopify stores have. Here's the maths.
Evan Miller's rule of thumb for sample size is n = 16 × p(1 - p) ÷ δ², where p is your current rate and δ is the change you want to detect. At a 1.3% conversion rate:
- To detect a 30% lift (1.3% to 1.69%): about 13,500 sessions per version, 27,000 total
- 20% lift: about 30,000 per version, 60,000 total
- 10% lift: about 121,000 per version, 243,000 total
So a store with 10,000 sessions a month needs six months to spot even a 20% lift on conversion rate. That's not a test. By then the season and your ads have changed.
What to do if you're below that line:
- Test on add-to-cart rate instead. At a 6.9% baseline, a 20% lift needs about 5,400 sessions per version.
- Run for full weeks. At least two, so weekdays and weekends are both in.
- Fix the sample size first and don't peek. Stopping the moment one version looks ahead is the most common way to get a false winner.
- Skip testing for obvious fixes. You don't need a test to know that hidden shipping costs hurt. Make the change and watch the trend.
Frequently asked questions
How to get a better conversion rate on Shopify?
Find the leaking stage first, then fix that stage. Open the Conversion rate breakdown report in Shopify Analytics and compare your add-to-cart rate and checkout completion with benchmarks. A low add-to-cart rate points to product pages, price and trust. Low checkout completion points to shipping costs, payment options and checkout friction. Fix one thing at a time and measure it for at least two full weeks.
What's a good conversion rate for a Shopify store?
Anything above 1.3% is better than the typical Shopify store, and above 2.8% puts you in the top 20%. Those are Littledata's November 2026 figures from 450 Shopify stores, measured per session. Industry matters a lot: beauty and skincare stores have a median of 2.8%, while fashion and home stores sit at 1.1%. Compare yourself with your own category, not the overall number.
Is 2.5% a good conversion rate?
Yes, for most Shopify stores. 2.5% is nearly double the 1.3% median in Littledata's November 2026 benchmark of 450 Shopify stores, and close to the 2.8% line for the top 20%. It's above the top-20% mark for fashion (1.7%) and home and furniture (1.8%). For beauty and skincare, where the median is 2.8%, it's slightly below average.
How much does Shopify take from a $100 sale?
On the Basic plan with Shopify Payments in the US, a $100 online card sale costs $3.20 (2.9% + 30 cents). On Grow it's $3.00 and on Advanced $2.80. If you use a third-party payment provider instead, Shopify adds a transaction fee of 2% on Basic, 1% on Grow or 0.6% on Advanced, on top of your provider's own fee. The monthly plan fee is separate. Rates are from Shopify's pricing page.
Where to start
Open the Conversion rate breakdown report today and work out your add-to-cart rate and checkout completion rate.
If add-to-cart is below 6.9%, start with your product pages: fixes 3, 4, 5 and 10. If checkout completion is below 47%, start with costs and checkout: fixes 2 and 8. If both look fine but the overall rate is low, look at speed and traffic quality.
Pick one fix, ship it, and give it a month before you judge it. If you want tools for any of these, here are apps that help with each of these.

Increase your sales and sign-ups by up
to 15% from $9/mo. only with our Social Proof & FOMO App
Add to Shopify